Donelson Files is a podcast that features politics, culture and entertainment. The webpage will include writers from right to left, discussing politics, sports, entertainment, culture and include photos, art and poetry.
I had the chance to interview Tom Nelson, who is positive that the debate on climate science is moving away from the alarmists to a more realistic approach that begins with there is no climate crisis. In his interview, he acknowledges that many on the skeptic side don’t universally agree on all issues including what the impact humans have as some don’t dispute human activity but wonder how much that impact is and others simply view natural events beyond human control. Regardless, there is no crisis existential or real as our planet has been warmer, colder (ice ages), and we had more CO2 in the atmosphere in the past and life flourishes. Nelson made an interesting point that many of climate alarmist scientists are the B team variety. I have seen a few debates where alarmist decide their science to the test, and they rarely win. Nelson himself noted he has challenged many to debate him and so far only three have shown up and as he quipped, “I am 3-0, undefeated.” If the pandemic showed us anything, scientists can be as much political whores as most politicians are. Most of the scientific community led by the likes of Debbie Birks (mediocre scientists) and Tony Fauci who basically hid the origin of the virus and were totally wrong on the lockdowns, lethality of the virus and hid the origins. Fauci and Collins went out of their way to destroy the careers of those opposed them and I might add climate alarmists have done the same. The pandemic skeptics were right about the big issues and the climate skeptics are equally correct in their science. The big story about the pandemic is that many scientists privately told Fauci that the virus was man-made but publicly say the opposite but many of them either had relations with Wuhan laboratories or grants not yet approved by Fauci. They were willing to prostitute themselves and their science for continued money flowing.
Certainly, if you are in climate science, want grants for research, tenure, and opportunity to move up the academic ladder, then you know which side you need to be on. While back a climate scientist admitted that he manipulated data to get published because if he had not, the article would have been rejected. Americans will not accept a lower standard living to “save the planet” and the Chines and Indians are building coal plants quicker, ignoring the wisdom of the climate alarmists. Tony Heller told me in a interview, when you debate alarmists, you need to understand they lie, and the best way is to emphasis energy production, which Trump is doing. As Tom Nelson observed, there is no crisis.
Vindication: White House Makes Major Website Update re: COVID Origins, Calls Out Fauci – RedState
This article details the recent government report on Covid origin, and this is important since what we saw was the abandonment of science and hiding the reality that this was most likely a virus released from Wuhan lab. What was and still at stake was the credibility of science and failure to place responsibility on the Chinese government. This was one of the great attempts by Tony Fauci to hide the truth and hide the fact that Tony Fauci helped finance gain of function research conducted by the Chinese.
A friend of mine who worked with Bush administration on getting vaccines to the market met Fauci and told me that Fauci support of the lockdown and the subsequent policies was designed to HIDE HIS FIANNCING of the virus research. Let be blunt, Fauci knew the lethality of the virus as he originally wrote that virus lethality between .1 to 1 percent in February 2020, but within a month, Fauci declared the death rate of Covid would be TEN TIMES of a flu season which turned out to be false as the Covid death rate was .2 to .5 depending on which study. This was similar to a bad flu season.
His original goal was correct and THERE WAS NO SCIENCE TO BACK HIS CHANGE OF MIND!! Fauci had to know the origin of the virus and it should be pointed out that CDC director Robert Redfield believed the virus was human made. (Redfield co-authored Fauci piece that original study on lethality but he was shut out by Fauci about the origin study by Fauci.) Fauci not only covered up the origin of the virus but advice the President that this a natural event even though he was being told by scientists privately this was human made. Fauci allowed the Chinese to get away with this and prefer to side with a foreign government as opposed to the rest of the world and the American people. He had to know the source of virus and much of his advice on the origin along with Mask mandates, school closing and lockdowns was wrong, and I suspect he knew that much of the advice was wrong. His advice was not just wrong, but it was disastrous for our economy and for many students whose fall behind in education. And his cover up on the origin was not just bad but it covered up the failure of gain of function research. Which he helped finance with American taxpayer’s help.
Here are some interesting studies that shows that maybe a higher CO2 is good for the planet and that the CO2 is causing a greening planet. Cortes et al noted that 15.8 million km2 of the surface has greened compared to 1.1 million km2 has browned 1 In another study presented by NoTrickZone,“CO2 fertilization is considered as the dominant factor responsible for the global greening phenomenon, contributing 70% of the increased global leaf area index (LAI) since the 1980s.”2 As No Tricks Kenneth Richards note about Guo paper, “And now a new analysis (Gao et al., 2022) suggests that even if the CO2 fertilization effect is held constant over the next 60 to 80 years, a global warming of 4.8°C will also result in even more net greening across the globe. The regions that are simulated to become browner are easily overwhelmed by the greening regions…So when it comes to vegetation, leaf area, and gross primary production, the effects of rising CO2 and rising temperature are net positive…This is likely not welcome news for those who wish to peddle climate alarmism.”3.
Satellite observations confirm that Planet grew greener over the last four decades and as Wu et al projected that this greening will continue through out century.4 One study stated that higher CO2 means more food and showed that .8 percent more crop per 1 ppm increase in CO2, so the increase CO2 improves agricultural output and the increase in C02 is acting as a plant fertilization and the results is increased crop yields. Normally in a sane world, this is considered good news.
Ken Richards “highlighted a new study indicating the rising greening trends in the last four decades can be attributed to the change in precipitation patterns and “the physiological impact of rising CO2…Greening-induced increases in evapotranspiration lead, in turn, to an increase in the global cloud cover. Increases in cloud cover reduce incoming solar radiation. A decline in incoming solar radiation cools the surface. So rising CO2 concentrations ultimately contribute to global-scale greening, and, consequently, to a surface cooling that offsets warming projections.”
NoTrickZone Ken Richards “ highlighted a another new study indicating the rising greening trends in the last four decades can be attributed to the change in precipitation patterns and “the physiological impact of rising CO2…Greening-induced increases in evapotranspiration lead, in turn, to an increase in the global cloud cover. Increases in cloud cover reduce incoming solar radiation. A decline in incoming solar radiation cools the surface… So rising CO2 concentrations ultimately contribute to global-scale greening, and, consequently, to a surface cooling that offsets warming projections.” 6.
What we conclude from these studies? The first point is that the planet is getting greener and not browning and this means that CO2 is adding to this planet greening. The second point is that CO2 aids in increasing crop yields and this means more food for us. Which is a good thing since we live in a world that surpasses 8 billion people.
Footnotes
Where Are Global Vegetation Greening and Browning Trends Significant? José Cortés1,2 Chi Chen5 , Miguel D. Mahecha2,3,4, Markus Reichstein2 , and Alexander Brenning
Effects of global greening phenomenon on water sustainability Yujiao Liu ab1, Yuanfang Chai c1, Yao Yue d, Yuyun Huang d, Yunping Yang e, Boyuan Zhu f, Dan Lou g, Yitian Li d, Dawei Shi h, Waheed Ullah i
Changes in Global Vegetation Distribution and Carbon Fluxes in Response to Global Warming: Simulated Results from IAP-DGVM in CAS-ESM2 Liu and NoTrickZone Ken Richards February 21 2021
Hydrological feedback from projected Earth greening in the 21st century Wu and NoTrickZone Feb 28, 2022
Environmental drives or Agricultural productivity Growth CO2 Fertilization of US Fields Crops Charles Taylor NBER
NoTrickzone July 28 2022, New Studies affirm rising CO2 Leads to Land Surface Colling by Driving Earth’s Greening Trends and Biophysical impacts of northern vegetation changes on seasonal warming patterns Lian
What if we are actually living in a period in which we are low on CO2? That our planet needs more Carbon Dioxide for plant life? The entire premise of the climate alarmist position is that we have too much Carbon Dioxide and need to cut back but this planet has had higher CO2 levels and certainly, as CO2 levels have gone up, we actually seen agricultural output increase to go with increase prosperity. We are feeding more people better diets today so the real question, what if we are looking for this issue backwards? Instead of worrying about too much Carbon Dioxide, maybe we need to worry about not enough Carbon Dioxide.
Plant life can die out if the overall CO2 levels are less 150 ppm, which nearly happened during the last glacial maximum and we are now at 420 ppm and the question do we still need more? As one observer noted, hothouse growers raise their CO2 between 1000 to 1200 ppm, and food plants like corn and rice grown faster and larger.
One solution of switching to solar and wind-turbine energy and away from fossil fuels for this project will increase energy prices and thus make us poorer. Wealthier nations not only feed their citizens better than developing nations, but they are cleaner environmentally because the extra wealth allows them to spend resources to clean their environment.
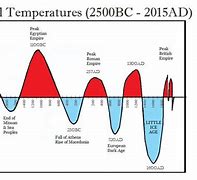
Climate science has abandoned the process of traditional science but what we are seeing with Climate science could be described as “Post-Normal Science,” which relies more on computer modeling that about reviewing the empirical evidence and testing out hypotheses. IPCC modeling run hotter than modeling results not supported by what observed by weather-ballon data and satellite data and long-term surface weather records and yet we are basing our policies on the models and models are only good as the variables included. Ken Wilson, a retired engineer noted, “We have been living in the Modern Warm Period since the end of the Little Ice Age (1300-1850). This is a moderate warming trend that is similar in character to that of the Medieval Warm Period about 1,000 years ago, the Roman Warm period about 2,000 years ago, and the Minoan Warm Period about 3,500 years ago. This is all happening within the Holocene Interglacial period, which ended almost 100,000 years of glaciation about 12,000 years ago. At the Holocene maximum, about 6,000 years ago, northern summers were about 4° Celsius warmer than today, almost all the glaciers had melted, a spruce forest was growing at Tuktoyaktuk, Northwest Territories, and sea levels were about 2 metres (6 feet) higher than today. We entered a Neoglacial cooling phase about 3,000 years ago. New glaciers began to form during temperature dips like the Little Ice Age.” 1.
One of the more interesting things is that Climate Change isn’t causing more deaths in adverse weather conditions just as hurricanes and tornadoes, but significantly less by more than 90 percent. This improvement is due to increase knowledge that allowed devised warning procedures and a good example of this was Hurricane Ian that hit Florida in 2022. 150 people total died in that hurricane compared to a similar hurricane that hit Galveston, Texas a century earlier and ended up killing 6,000 to 8,000 people.2
6000 deaths compared to 150 is considerable difference and in the case of Ian, Florida was able to fix roads, get the electrical grid back up in as short period of time and even islands off the Florida coast had bridges repaired to ensure food, drugs and supplies were able to get through.
Different researchers have noted that we have witnessed warmer temperatures over the past several millenniums. Among the conclusion includes, “ During the warmest part of the Holocene about 6,000 years ago … summer temperatures were as much as 40C above present. Glaciers disappeared from the Rocky Mountains and other high mountains. They began to reform about 3,000 years ago during a cool episode known as the Neoglacial and further expanded during the Little Ice Age of the past few hundred years.” 39 “It is now recognized that swings in climate after the Neoglacial occur on a roughly 1,000-year periodicity as part of what is known as the millennial scale oscillation. A prominent warm phase occurred 2,000 years ago during the Roman Empire (the Roman Warm Period). The Dark Ages Cold Period of approximately 100 to 800 CE was followed in turn by the Medieval Warm Period, which refers to a few hundred years that peaked around 1000 CE. During this warm period, glaciers retreated, but cooler conditions returned during the Little Ice Age of 1350 to 1850 CE. Mountain glaciers grew worldwide such that in the mid-nineteenth century they were larger than during anytime in the past 10,000 years.”3.
As the chart below shows, we have seen as warm temperatures if not warmer in the last two thousand years. 4
So, what caused this warming period of the past and what caused those colder periods as well? That is a question that should be answered before we decide to essentially wipe out civilization as we know it and return our economy to the medieval periods.
My purpose is not assuming that we need more CO2 only to tell the readers that the science is unsettled and there is much to learn and know before we decided to place radical solutions that could end up killing billions.
The Washington Post in an editorial called for Humans to reengineer the climate to save the planet. “Climate engineering scholars” David Keith and Wake Smith believe that we can have 15 souped up gulfstreams to put 100,000 tons of sulfur in the lower stratosphere to block solar rays only for half billion dollars over five years. Note I put quotation over “Climate engineering scholars” since how can anyone be so stupid to actually consider having governments change the weather. We just witnessed what happened in United Arab Emirates when the government added cloud seeding to a front coming in and flooding resulted.
In the early 1980’s, one study supposedly stated that 100 nuclear wars unleashed at one time would produce a nuclear winter along with the radiation and other impacts of a nuclear war. This was considered a bad thing but now we have “scientists” who want to make this planet colder and produce their version of a nuclear winter only without unleashing nuclear weapons.5.
We live in an era in which up is down and down is up, an upside world in which our so-called experts want a colder planet. Makes no sense but here we are with some of the idiotic ideas to save the planet which would result in the end of civilization as we know it and the Middle class in the developed world grinded into poverty and billions of those in the developing world starving to death and the survivors will merely barely getting by.
Some of the dumb ideas include:
1. Blocking the sun to reduce climate warming what could go wrong? In 1981, Carl Sagan and others warned of a nuclear winter as result of a nuclear exchange with small percentages of nuclear arsenal release. Now the Biden administration is seriously considering plans to do this, introduce a nuclear winter without of the nuclear weapons and supported research by Bill Gates. Remember more people die in cold weather and introducing cold weather would shorten growing season. This will put billions around the world on the verge of starvation.6
2. Reducing farmer yields, taking farmland out of circulations, reducing any use of fossil fuels or nitrogen for fertilizers. Our elites want us to eat bugs in place of meat since raising cows and pigs is bad for the planet. What we are talking about is engineering massive famines beginning in the developing world. 7
3. Eliminate fossil fuels that power our civilization with no replacement. So far EV’s are not selling due to their high cost but despite that the average American don’t want them, the Biden administration will force us to buy them. How do you recharge your EV’s without fossil fuels plant? Without fossil fuels, we are talking about returning our world to the 18th and early 19th centuries. As a result, poverty increase, and economic prosperity declines and that is a best-case scenario.
Just look at some of the ideas and the results is increase poverty and increase death from lack of food, higher food and energy prices, unreliable energy, and widespread poverty. The reality is that many are waking up to the cost of net zero and finding they are not interested in paying the price in higher prices and lower living standards.
Many climates alarmist viewed the Pandemic lockdowns as a model for a future declared climate emergency and never mind the Pandemic lockdowns were a complete failure in stopping the virus and the loss of freedoms and various mandates resulted in loss of businesses and increase excess mortality. This is the plan on a larger scale that is being planned by the climate alarmists.
Sri Lanka has already experimented with these ideas and within two years, the country went from being a food exporter to the food importer, the economy and government collapsed, and people put on the verge of starvation. We had a grand experiment when a warmer climate, a little extra CO2 and rise of free market economy showed that the complete opposite happened, increase prosperity, greener planet, more food being raised, higher GDP per capita. That is what the climate alarmists want to stop and instead replace it with a world with more poverty, people starving in the billions and a decreased standard of living.. We have done our experiments and guess what the climate alarmists want to see happen. The opposite of what will make this a better world.8
Science is unsettled and there is much to learn and discuss and we don’t even know for certain what is the optimal CO2 levels and there is plenty of evidence to suggest we might need more CO2! What we do know is that with the expansion of market economy and as part of the development of market economy, the development of fossil fuels which has led to greatest prosperity the world has seen and while there is much more to do and accomplished, we know that our hope is the continuation and further spread of free market economy worldwide. The only way we will see massive famines and worldwide poverty is to abandon this approach and follow the advice of the so-called climate experts and their economic plan of a control economy. Under just these experts plan, we will see less freedom, less prosperity, more poverty, and massive deaths from starvation. History has shown what works to alleviate poverty and allow us to survive whatever Mother nature imposes on us. And the tragedy is that our “climate experts” and alarmist deny science, the economic data and history in proposing their solutions. They are the true deniers of data and science.
Footnote
Ken Wilson The IPCC VS. The Facts, The Case for Climate Realism. Reviewed by Paul MacRae.
National Hurricane Center Tropical Cyclone Report Hurrian Ian April 2023, Hurricane Ian, Wikipedia, 1900 Galveston Hurricane History June 10, 2019.
Global institutions series, 49) Peter Willetts-Non-Governmental Organisations in World Politics -Routledge (2011).pdf, p76 Pielou, E., p. 273, ‘After the Ice Age – The Return of Life to Glaciated North America’, The University of Chicago Press, 1992. Lewin, Bernie, pp. 229-230, ‘Searching for the Catastrophe Signal: The Origins of the Intergovernmental Panel on Climate Change.’ Global Warming Policy Foundation. Kindle Edition. Christy, J., minute 35 https://www.youtube.com/watch?v=D2Cd4MLUoN0
The Washington Post in an editorial call out for Humans to reengineer the climate to save the planet. “Climate engineering scholars” David Keith and Wake Smith believe that we can have 15 souped up gulfstreams to put 100,000 tons of sulfur in the lower stratosphere to block solar rays only for half billion dollars over five years. Note I put quotation over “Climate engineering scholars” since how can anyone be so stupid to actually consider having governments change the weather. We just witnessed what happened in United Arab Emirates when the government added cloud seeding to a front coming in and flooding resulted.
In the early 1980’s, one study supposedly stated that 100 nuclear wars unleashed at one time would produce a nuclear winter along with the radiation and other impacts of a nuclear war. This was considered a bad thing but now we have “scientists” who want to make this planet colder and produce their version of a nuclear winter only without unleashing nuclear weapons.
Of course, our brilliant scientists and thought leaders have not understand that a few nations would not like the idea United States or other Western nations changing the weather and this potentially could spark a conflict or two.
This is not a new idea, as Marc Morano noted, “This is retro 1970s. In the 1970s, they believed fossil fuels were creating aerosols blocking the sun, creating man-made global cooling. So, they came up with the same kind of geo-engineering solutions back then. They wanted to put black soot on the Arctic to melt it. There was one proposal that was to use nuclear energy to loosen the Arctic ice caps because they thought they were growing too much. John Holdren (Science Czar) in the Obama Administration supported geo-engineering, if you will, of the climate. This is radical, risky, unproven, with unknown effects but they are doing it as a sort of lever over us…. ABC News meteorologists (Ginger Zee) talked about the cloud seeding to increase rain, snow, or storms, They will — the government will control the weather, and you will be Happy. That seems to be the new motto.”
This is one of those ideas that should be simply rejected but there are scientists, activists and politicians who love to play God and somehow the idea that a government can actually control the weather is not only delusional but dangerous We are purposedly creating a colder planet and yet to hear one scientists tells us why we need to a colder planet when more people die during colder weather and shorter planting season for farming could lead to less yields for farmers and less food for the rest of us.
We can only look at studies dealing with the gain of functions with virus to know the potential for disaster with geo-engineering. Many policy makers have refused to come to grip that Covid was most likely a lab accident in a facility working on making virus more potent. Anthony Fauci and other scientists who have supported this research did everything they could to cover up the fact that Wuhan lab was involved in gain of function research and that United States helped finance this. The possibility that Covid was research supported by American taxpayer and escaped from Chinese laboratory is becoming more the actual truth, millions around the world died as a result with the same brilliant experts demanding we lockdown our economy, close our schools and our businesses to no avail.
The same is true with adding foreign substances to change weather patterns. We don’t know the results will be, but it is certainty that will have a negative impact on our planet and civilization. Play God and disaster will happen.
Here is a thought exercise. If someone told you that over the past six decades as the weather warmed up, and CO2 increased, we would see more prosperous planet with more people moving into the middle class, the planet greener, and for many in the developed world, the Middle Class will access to increase travel and lifestyle that was only available to the rich generations earlier, you would think that was a good thing. As the planet got greener, we would see increase agriculture production in which we are able to feed more than double population from sixty years ago better diets. Less people die in warmer weather from exposure than colder weather, you would think that was good. As the planet got warmer, the world became a better place to live and despite predictions otherwise, a warming planet is a variable for a better future!
We live in an era in which up is down and down is up, an upside world in which our so-called experts want a colder planet. Makes no sense but here we are with some of the idiotic ideas to save the planet which would result in the end of civilization as we know it and the Middle class in the developed world grinded into poverty and billions of those in the developing world starving to death and the survivors will merely barely getting by.
Reducing farmer yields, taking farmland out of circulations, reduced any use of fossil fuels or nitrogen for fertilizers. Our elites want us to eat bugs in place of meat since raising cows and pigs is bad for the planet. What we are talking about is engineering massive famines beginning in the developing world. Joe Biden’s Net-Zero Agenda Spells Trouble Down on the Farm and at the Supermarket – Watts Up With That?
Eliminate fossil fuels that power our civilization with no replacement. So far EV’s are not selling due to their high cost but despite that the average American don’t want them, the Biden administration will force us to buy them. How do you recharge your EV’s without fossil fuels plant? Without fossil fuels, we are talking about returning our world to the 18th and early 19th centuries. As a result, poverty increase, and economic prosperity declines and that is a best-case scenario.
Just look at some of the ideas and the results is increase poverty and increase death from lack of food, higher food and energy prices, unreliable energy, and widespread poverty. The reality is that many are waking up to the cost of net zero and finding they are not interested in paying the price in higher prices and lower living standards.
Many climates alarmist viewed the Pandemic lockdowns as a model for a future declared climate emergency and never mind the Pandemic lockdowns were a complete failure in stopping the virus and the loss of freedoms and various mandates resulted in loss of businesses and increase excess mortality. This is the plan on a larger scale that is being planned by the climate alarmists.
Sri Lanka has already experimented with these ideas and within two years, the country went from being a food exporter to the food importer, the economy and government collapsed, and people put on the verge of starvation. Sri Lanka Begging Russia and India for Fuel: A Nation Wrecked by Green Agricultural Policies – Watts Up With That?, From Sri Lanka to Salinas – Watts Up With That? We had a grand experiment when a warmer climate, a little extra CO2 and rise of free market economy showed that the complete opposite happened, increase prosperity, greener planet, more food being raised, higher GDP per capita. That is what the climate alarmists want to stop and instead replace if with a world with more poverty, people starving in the billions and a decreased standard of living.. We have done our experiments and guess what the climate alarmists want to see happen. The opposite of what will make this a better world.
A funny thought occurred to me, dealing with Michael Mann, noted climate alarmist scientist and the inventor of the famous hockey stick. The thought was Mann own hockey stick with excessive CO2 and rise in temperature coincided with the most rapid growth of prosperity world have ever seen. We have seen more people being fed better diets, less people living in poverty, and multiple rise in economic growth and GDP per capita growth. Mann own research supports the narrative that higher CO2 and warmer temperatures are not bad for the planet but are variables that is actually good for the planet.
Climate the Movie directed by Martin Durkin and produced by Tom Nelson is full of many gems that debunk much of the science behind the recent Climate crisis scare. Durkin interviews many experts and when I say experts, I mean some of the leading scientists in the field including Will Happier, Richard Lindzen, Steve Koonin, and John Clauser among others. These experts have taught at Princeton, MIT, University of California among others and Clauser was just rewarded a Nobel Prize in Science. That is an elite group of experts.
The film examines the science behind climate change alarmist arguments, beginning with the actual climate history of this planet which goes back hundred of million of years of data collected. We find that our planet has been warmer and CO2 levels higher but life flourished. Even in the past thousands of years, we have seen our planet as warm if not warmer than today including the Roman warming period and the Medieval warming period.
The scientists noted that we are living through overall cooling period that has lasted for thousands of years and many of the scientists interviewed added we are also in the midst of a CO2 dearth and as one scientist noted, we may have come close thousands of years ago of a catastrophic event when the CO2 sunk to extreme low and if it had reached lower, life as we know it would cease to exist.
The case made by the scientist are far superior to the arguments of the alarmists and this has been shown when these ideas get explored side by side. A few years, Richard Lindzen and a team debated a team led by Galvin Schmidt and after the debate, many who sided with Schmidt reversed their position and changed over to Lindzen (going into the debate, nearly two out of three favored Schmidt assertion we had a climate crisis but afterwards a plurality sided with Lindzen. Schmidt never has debated a climate opponent again.) Two years ago, Steve Koonin debated Andrew Dessler in Greenwich village and again the results were the same, Koonin changed 20 percent of the audience over to his side and easily won the debate. It got so bad for Dessler that he was forced to apologize to Koonin about an article he coauthored attacking Koonin position and Koonin’s book, Unsettled.
So why isn’t the position of climate skeptics taken more seriously? As the film makes clear, despite the expertise of these individuals, the reality is that there is a systemic censoring of their ideas. Many scientific journals will not publish their ideas, they are attacked as deniers and many younger scientists understand that to take a position counter to the narrative will cost them their academic career plus government grants goes to those who accept the narrative of climate crisis. They are shunned and there is an attempt to silence anyone who dares to oppose the climate alarmist point of view. The term denier was originally designed to equate these brilliant minds as no better than holocaust deniers. During the recent Pandemic, we saw similar attempts to censor opponents of the lockdowns, but the evidence was so overwhelming that the lockdowns were failures, it was hard not to hide the anti-lockdown arguments. The one optimistic view that film leaves us with is that when the average voters see the price of the alarmists ideas of dealing with the crisis, they are starting to rebel including farmers who being told, don’t farm, to the rise in energy cost for the average consumers. Developing nations around the world, in particular Africa, are being told they have to forsake fossil fuels that led to prosperity of much of the developed world and many don’t like the message they must continue to live in poverty. China and India are developing coal plants for energy and ignoring by policies that will reduce their own ability to prosper. They may pay lip service to green arguments but in practices, they simply don’t care and ignore the alarmists arguments.
This film is worth the view and remember that when fossil fuels along with free market economics began to take hold on a worldwide basis, we saw prosperity never before experienced. While much of the environmentalist movement has used this “crisis” to declare war on free market, the reality is that without fossil fuels whose development came as result of market economy has allowed much of the middle class to enjoy a lifestyle that was reserved only for the rich a century ago. One place you can see the film is here Climate The Movie: Watch Here – Watts Up With That?.
Do I believe that the climate is changing? Yes, but that like saying I believe that sun will rise in the East and lower in the West or that the world is really round. Climate has been changing since the time this planet was formed and will continue to change over the next millennium. Here is what I do believe, first there is no climate emergency that needs to be addressed and the second, if we actually follow the advice of climate alarmist, humanity will be worse off. Their cure for climate change is the end of civilization and the death of billions. They want to destroy the planet to save it.
Michael Walsh in pipeline noted, “Only an illiterate or a fool cannot understand this elementary concept. There is no need to delve into any scientific studies based on wildly or deliberately inaccurate computer “models” to know this. There is no need to be emotionally stampeded by tiresome, and always wrong, Jeremiahs of doom like Paul Ehrlich. There is no truth in the statistical manipulation that proclaims a full 97 percent of “climate scientists” agree that changes in the climate are the work of mankind. You don’t have to worry about carbon emissions. The Last Days are not upon us.” And what are the goals of the Climate alarmists? About their goals, Walsh observed, “But the “climate movement” bids fair to undo everything Western man has accomplished in the fields of science, technology, and religion and replace it with a savage new primitivism that is both inhuman and godless. It relies on the patina of science to promote a culture based on fear and guilt, with the goal of reducing and taming the human population under the aegis of a small group of self-appointed bonzes.”
As mention, they want to destroy civilization to save the Planet and somehow this doesn’t seem to be much of suitable option. If your goal is to destroy your civilization to save the planet, maybe you might want to reconsider the nature of the problem and whether you will do more damage than good to deal with the issue.
Consider what Walsh has noticed, “In Holland, the leftist government is attempting to forcibly seize farmers’ land in order to take it out of food production to appease this new Moloch. Meanwhile in Ireland its government of mediocrities has been captured by the Green Party, which now holds all its important ministries, and has decreed that some 200,000 heads of cattle be culled in order to meet its “mandated” emissions targets — a report that instantly made the poor beleaguered country a laughingstock around the world, and from which Éire now seems to be backing away. The fact that, historically, cattle have been integral to the country’s sense of itself — viz. the epic poem, Táin bó Cuailnge (The Cattle Raid of Cooley), which dates from the seventh century A.D. — and was the standard by which wealth was measured means nothing to the Eurocrats in Dublin who function at Brussels’ behest. Expect more of the same across Europe, which even now is struggling with soaring energy costs and reduced access to dependable sources of power.” Seizing farms in order to reduce food production is suicidal for those who depends upon the Dutch’s exports and Irish sacrifice to the gods of climate change cult is to kill 200,000 cows.
Carbon Dioxide is an important aspect of our life, without which we could not live. We are carbon emitters every time we breathe, and plants take that CO2 and returns us Oxygen, it is called photosynthesis. Most of us learned this in elementary school or used to. We are a carbon form based of life and Walsh observed, “Carbon is the graphite in our pencils, the diamond in our rings, the oil in our cars, the sugar in our coffee, the DNA in our cells, the air in our lungs, the food on our plates, the cattle in our fields, the forest in our parks, the cement in our sidewalks, the steel in our skyscrapers, the charcoal in our grills, the fizz in our sodas, the foam in our fire extinguishers, the ink in our pens, the plastic in our toys, the wood in our chairs, the leather in our jackets, the battery in our cars, the rubber in our tires, the coal in our power plants, the nano in our nanotechnology, and the life in our soils… Carbon is life. It exists in every organic life form. Life is impossible without it. When combined with water, it forms sugars, fats, alcohols, and terpenes. When combined with nitrogen and sulfur, it forms amino acids, antibiotics, and alkaloids. With the addition of phosphorus, it forms DNA and RNA, the essential codes of life, as well as ATP, the critical energy-transfer molecule found in all living cells. The carbon atom is the essential building block of life.”
Walsh concluded the real goal of Climate alarmist, “There is nothing urgent about climate change. The earth will continue to warm and cool until the day the Sun dies…Nothing bad will happen in either the short- or long-term if global temperatures rise by two degrees centigrade, the arbitrary figure of alarm for the cultists. Indeed, a slight warming will help all of humanity…Many of the people promoting the panic emerge from the malign precincts of the World Economic Forum which, under its Bond villain-in-chief, Klaus Schwab, is dedicated to the impoverishment and reduction of the human population. These are the same people who gave you the recent Covid hugger-mugger, which needlessly atomized the world’s economies and illegally locked down whole populations while cowering from a bug of next-to-zero lethality in the general population…When you have “net-zero” emissions, you are dead.”
We have taken an essential block of life on Earth and turned it into a pollutant. We are told by our “betters” to follow the science but the science they follow is absurd. As we witness during the Covid pandemic, following the science of the “our scientific leader” including Tony Fauci and Debbie Birks, we engaged in vaccine mandates for a less than effective vaccine, mask mandates that did nothing to stop the spread, economic lockdowns along with shutting down schools had both economic and educational disastrous results plus hiding the real origin of the virus. Following the science did not stop the virus but it did shut down much of the world economy for no real benefits. The lockdowns outweighed any benefits, and the solutions of climate alarmist risk outweighed any benefit. We won’t save the Planet by locking down our economy because of climate emergency that doesn’t exist, but we will kill billions and destroy civilization as we know it.