Lessons From the pandemic

2017 Covers.pdf (amermaj.org)

Data-Efficacy.pdf (amermaj.org)

An-Ignored-Cost.pdf (amermaj.org)

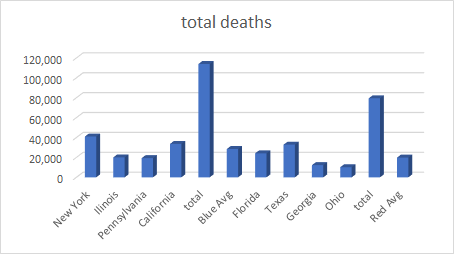
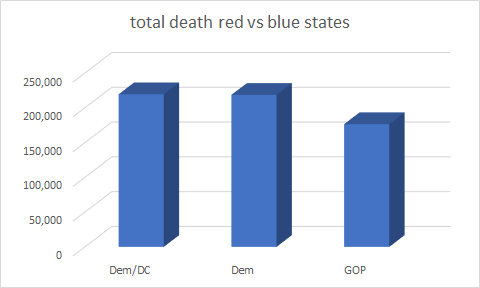
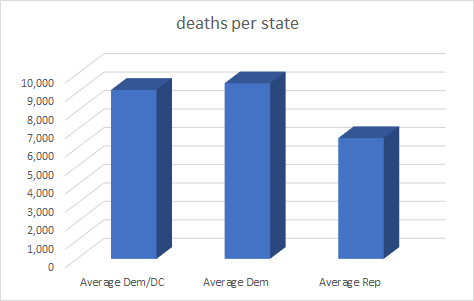
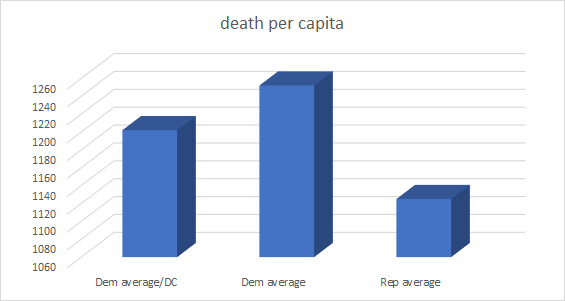
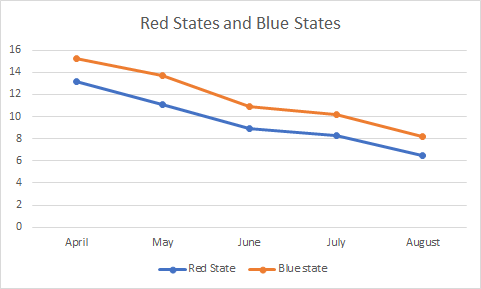
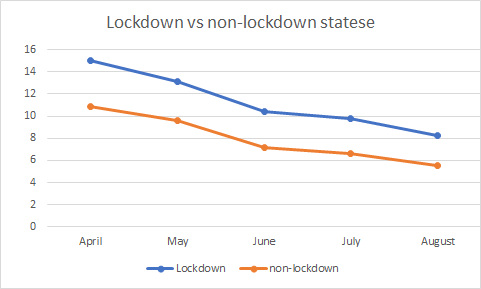
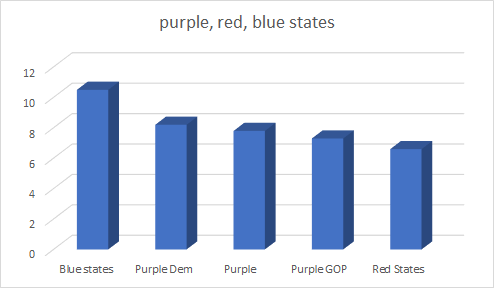
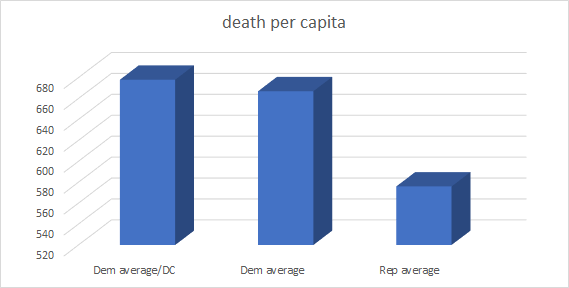
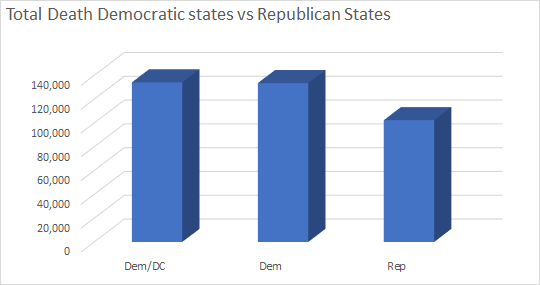
We reviewed from different angles the failure of the lockdown. As the data shows that non-lockdown states and red states outperformed lockdown states and blues states.

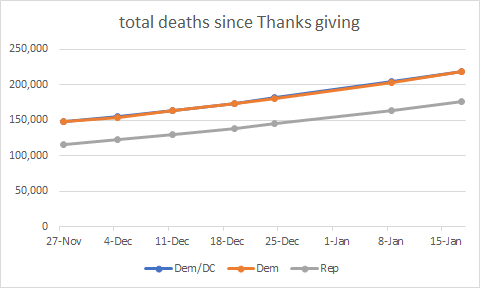
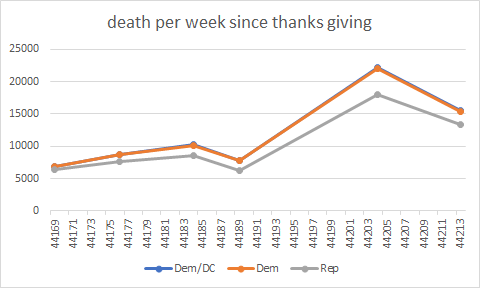
  1. We found that there were no significant differences in death between non-lockdown and red states versus lockdown and blue states.
  2. That minorities were more likely to die from Corona virus in lockdown and blue states.
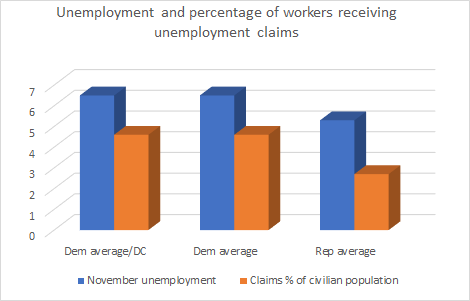
  3. As mention, economic growth and job growth were superior in Red and non-lockdown states.
  4. That other data referenced in our study, that more people have or will die from the lockdown than saved from the virus.
  5. We saw these trends from our data and others from the past year.
  6. Lockdowns were a failure.

stats: Covid death Red vs Blue states

Total deaths eight populous states and note more deaths in Blue state

Total death of Red vs Blue states

Death per state and note Red states less death.

more death per capita in blue states

less death, less unemployment less need for unemployment
death from thanksgiving
weekly death from thanksgiving and note more from blue states

Counting Covid’s Death

Here is interesting thought. How much of the deaths reported are not necessarily caused by Covid but people who die with Covid? In Colorado, they have two set of numbers, one number they report and a second they try more accurately to determine if Covid was the cause.

Colorado data may show 20% of deaths not caused by Covid. Florida is now estimating as high as 40% If they are both right, we are talking 180,000 deaths to 240,000 deaths. Still high by past flu pandemic past decade. 2018 flu based on similar infection and population, would be 160,000.

Tweets on death

Considering that I have been 90 percent plus correct with many of my numbers in March and April on the Lockdown impact on the economy, IFR, the number of undiagnosed cases of Covid outnumbering diagnose case and the number of mild cases far higher than was being reported in April.

The one area I underestimated was the number of infections. Past flu season, we have seen seen 45 to 60 million infected, which means 20% or less of the population infected before the virus disappeared. According to CDC, we may have 100 to 110, 000 infected.

That is a third of the population. There are many reasons including novelty of the virus or the lockdown delaying the normal transmission or the virus but Covid has infected nearly double of the flu season normally does.

This could account for the half of the deaths we have seen. Thoughts? I underestimated how many people would get infected. So this is part of the 10% or less I got wrong. Still impressive track record and better than 80% of those commenting on this.

Data

Data  unemployment through May and claims % of civilian Population June 13 Democrats average include DC and not include DC.


May unemployment Claims % of civilian population
Dem average/DC 14.1 13.8
Dem average 14.3 13.6
Rep average 11.4 9.5

Deaths per capital

Death per capita death per million
Dem average/DC 418.3
Dem average 404
Rep average 210


data top 25 with Lowest unemployment claims by percentage and death per capita

may 2nd may 23rd May 30th June 6th Death per capita
South Dakota 6% 5.60% 4.50% 4.60% 83
Utah 6.20% 5.30% 5.10% 5.10% 40
Idaho 8.70% 6.70% 5.90% 5.60% 48
Nebraska 6.90% 6.40% 6.10% 6.10% 101
Arizona 7% 7% 6.20% 6.20% 155
Wyoming 7.20% 7.20% 6.50% 6.30% 31
Indiana 9.60% 8.50% 7.80% 7.40% 354
Kansas 9.70% 8.20% 7.90% 7.60% 83
Missouri 9.40% 9.20% 8.20% 8% 142
Maryland 8.80% 8.60% 8.30% 8.50% 476
Alabama 10.60% 9.50% 8.90% 8.50% 154
Colorado 8.10% 8.80% 8.10% 8.70% 276
Arkansas 9.50% 9.30% 8.80% 8.80% 55
Montana 12.40% 9.80% 9.40% 8.90% 17
Wisconsin 11.40% 10% 9.50% 9.10% 115
North Dakota 11% 9.60% 9.50% 9.30% 97
Texas 9.80% 10% 10.80% 9.30% 66
Ohio 13.20% 11.30% 10% 9.40% 211
Virginia 9.80% 9.80% 9.60% 9.50% 178
Tennessee 11.10% 10.40% 10% 9.70% 64
South Carolina 12.70% 11.10% 10% 9.70% 112
Iowa 11.90% 11.30% 9.90% 9.80% 203
Florida 5.70% 6.50% 7.80% 10% 122
Oklahoma 12.10% 9.10% 11.20% 10.90% 90
North Carolina 13.10% 11.80% 11.30% 11% 105