Below is reason for admissions.

The headline Fauci states 100,000 to 200,000 is design to scare Americans and of course, made Donald Trump look bad. Equally accurate headline, Fauci states death rates headed toward a bad flu season. Note the difference here and of course models they are based on available data or guess work on how Americans will react to dealing with the virus.
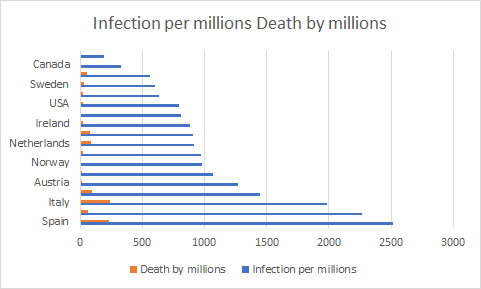
As I have mention, there is many aspects to how guess the final numbers. One is the infection rate and based on those tested vs those infected. On the cruise liner Diamond Princess, between 17 to 20% became infected and reviewing about 1,000,000 tested, 10 percent were found infected. A little over 1% of those infected died and overall, only .2 percent died among the 3700 plus of those crew and passengers. Since not everyone will be tested and much of the data, we are seeing on mortality rate is based on those confirmed and do not count many mild cases are not being tested so the overall mortality rates will be overestimated. At 20 percent infected, we will see a little over 60 million infected and up to 600,000 dead based on 1% mortality. At .1 percent, that number would be 60 thousand.
As mention, we may see a less infected rate and the numbers could be half of the 60 million and the death total would be between 30,000 to 300,000. Fauci numbers are in line with many of experts and 100,000 is equal to a bad flu season and 200,000 is one tenth of the Spanish Flu a century ago on a per capita basis. Those numbers would represent a victory for the Trump administration since they would be able to say lives were saved. The media won’t report as such but then truth and much of the modern-day media, truth is only optional.
A few weeks ago, Donald Trump was criticized for practicing medicine with his support of the combination of hydroxychloroquine/Chloroquine and Azithromycin. Here we are three weeks later and guess what, it is now the standard of care. Standard of care is not the same as being approved for the indications. It does indicate that this combination should be used in specific situations as a treatment of choice. A French researcher concluded after study he conducted, “In conclusion, we confirm the efficacy of hydroxychloroquine associated with azithromycin in the treatment of COVID-19 and its potential effectiveness in the early impairment of contagiousness. Given the urgent therapeutic need to manage this disease with effective and safe drugs and given the negligible cost of both hydroxychloroquine and azithromycin, we believe that other teams should urgently evaluate this therapeutic strategy both to avoid the spread of the disease and to treat patients before severe irreversible respiratory complications take hold.” The researcher added to reinforce the standard of care, “Our study concerns 80 patients, without a control group because we offer our protocol to all patients with no contraindication. This is what the Hippocratic Oath that we have taken dictates to us.”
Infectious Disease Specialist Dr. Daniel Hinthorn followed up these thoughts in co-authored editorial with Jeff Coyler in the Wall Street Journal when they wrote, “We have decades of experience in treating infectious diseases and dealing with epidemics, and we believe in safety and efficacy. We don’t want to peddle false hope; we have seen promising drugs turn out to be duds.
But the public expects an answer, and we don’t have the luxury of time. We have a drug with an excellent safety profile but limited clinical outcomes—and no better alternatives until long after this disaster peaks. We can use this treatment to help save lives and prevent others from becoming infected. Or we can wait several weeks and risk discovering we didn’t do everything we could to end this pandemic as quickly as possible.” And they concurred with President Trump decision to promote the drug combination, “President Trump touted hydroxychloroquine in his Thursday press conference as a potential treatment, which is a welcome move. And this isn’t only about treatment. Rapid and strategic use of these drugs could help arrest the spread of the disease.”
This drug combination is a step in controlling this virus and will save lives. Like Trump, I was criticized for discussing this combination but now I have been proven correct again. I have noted that there are side effects with these drugs and that we are still learning how best to use this combination but added, it appeared to be a valuable aid in saving lives and stopping the spread of the virus.
| The Dems and climate change: a ship of fools! |
 They want to fix false problems with solutions that don’t work! They want to fix false problems with solutions that don’t work!By Dr. Larry Fedewa (March 2, 2020) One of the pillars of the internationalist world view that is solemnly proclaimed by the establishment is the dogma of climate change – what it is and how to fix it. This view is accepted aa a fixture by such institutions as the United Nations and many national governments, including until recently, the United States government. We can thank President Trump for rejecting this nonsense. He withdrew the USA from the Paris Accord (which was negotiated by the Obama Administration, but never submitted to the Senate and therefore not ratified by the USA). Most Democrat presidential candidates want to eliminate fossil fuels in 10 years although the entire world depends on fossil fuels for survival, and there is no comparable substitute for fossil fuels. Windmills are not only inconsistent, but they also create new environmental hazards. Solar panels seem to have a place for supplementary energy production, but they are not transportable or suitable for transportation. Even their statement of the problem is out of date. Nobody can look at the violent weather we have been experiencing and doubt that the climate is changing. But when has it ever not been changing? As far back as records go there have been changes in the climate. Remember the Ice Age? Yesterday the scientists were telling us that there is global warming and the polar ice cap is melting. If that were true, battery-driven cars wouldn’t help us much. The first thing to do would be to move all the seaside structures to higher ground (as Andrew Yang has recommended). But we see large numbers of people who won’t even move their towns away from flood plains after being flooded out every other year. How are we going to move New York City or Los Angeles inland? Luckily. more recent data are showing that the ice cap isn’t melting anymore. Not only that, but after the Club of Rome’s first two reports (1972 & 1976) scared us all with the idea that pollution is the common enemy of all mankind but was controllable by human carbon emissions, the more sober climatologists have begun to assert that human intervention is vastly overrated. In fact, humans can’t change the weather; that’s just common sense. (In 1996, The Club of Rome admitted that “pollution” was actually used in their early reports as merely an intellectual construct aimed at uniting nations to rally to their cause). It is true that air, water and food pollution are dramatically affected by human waste and therefore controllable by humans. But most of the damage in today’s world is done by the thickening of the world’s ozone layer (between the sun and the earth’s surface) which in turn is exacerbated by increased emissions of carbon dioxide. These emissions apparently are affected by the burning of fossil fuels like coal and petroleum products such as gasoline and fuel oil. The most prolific producers of these pollutants are developing nations which were not even included in the Paris Accords’ quotas. It was basically an agreement by which the USA would pay for as much of the world pollution as India and China wanted cleaned up. Every Democrat running for the presidency vows to reinstate the Paris Accord. The actual situation in the USA and the world was summarized in a press release from the UN’s International Energy Agency (IEA) as follows: “Despite media reports predicting the contrary, U.S. energy-related carbon dioxide emissions fell 2.9 percent last year, according to a report published Tuesday.In fact, the International Energy Agency (IEA) found that the U.S. decrease in emissions was the largest total of any country, at 140 million tons. It also noted that over the last 20 years, U.S. emissions have decreased nearly one gigaton (1 billion metric tons).Globally, emissions flatlined in 2019. After two years of growth, global emissions remained unchanged at 33 gigatons in 2019, even as the world economy grew by 2.9 percent.” (Fox News story, 2/11/2019) The distribution of global activity is in the IEA release: “A significant decrease in emissions in advanced economies in 2019 offset continued growth elsewhere. Emission in the European Union fell by 160 million tons, or five percent, driven by reductions in the power sector. For the first time ever, natural gas produced more electricity than coal and wind-powered electricity nearly caught up with coal-fired electricity. Japan’s emissions fell by 45 million tons, or around 4 percent, as output from newly restarted nuclear reactors upticked this year. Emissions in most of the rest of the world grew by nearly 400 million tons in 2019, with almost 80 percent coming from countries in Asia where coal-fired power generation continued to rise.” (IEA, 2/11/2019) Thus, not only is the USA already doing its part to alleviate the effects of ozone pollution, but so are many other countries. The “existential crisis” of which Bernie Sanders so often speaks does not exist. This is not to say that nothing more should be done about ozone pollution. The old saying applies: “Because you can’t do everything doesn’t mean you should so nothing.” We can and should do what we can to affect this problem. But our efforts are necessarily limited. For example, we can’t stop volcanos from releasing more pollution in a day than humans can in weeks if not years. Our ancestors successfully adapted to continuous, sometimes drastic, weather changes. So can we. I have argued elsewhere that a new set of ethical standards with respect to the world around us should be formed. Traditional Western religion teaches us that all other creatures exist for use by humans. I believe that modern science has given us another view of the complexities of the world. We must learn to treat this world with more respect and more consideration. Appreciation for the beauty and brilliance of the world God has given us is a good first step. Crying WOLF! WOLF! is not. © 2020 Richfield Press. All rights reserved. |
| Dr. Howell’s best books on USA’s health care reformThe private sector surges forward while Government stalls |
 By Terry Howell, Ed.D. (February 18, 2020) Did you realize healthcare costs went up 250% over the last 20 years while everything else went up only 50% on average? Do you know why? What can be done? Plenty! For anyone who is interested, and all of us should be, here are some excellent resources detailing what is going on in healthcare and why it needs to be disrupted (i.e. reformed) in a big way. I especially like Dave Chase’s book and Ted Talk about how it is being disrupted by self-insured employers (see below). And then, of course, there is always our book, Healthcare is Killing US: The Power of Disruptive Innovation to Create a System that Cares More and Costs Less (Aaron Fausz, PhD and Terry Howell, EdD) https://www.healthcareiskillingus.com/ The Good News – there are already MANY industry insiders who have figured out how to play The New Game, and they’re all willing to collaborate with you to help you win. If you read or scan one book on how The Game is being played by the current players, make it this one: Unaccountable: What Hospitals Won’t Tell You and How Transparency Can Revolutionize Healthcare. By Marty Makary, MD. Other very useful resources include:Overtreated: Why too much medicine is making us Sicker and Poorer. By Shannon Brownlee. Ms. Brownlee, a founder of The Right Care Alliance, dismantles the myths surrounding our current model that result in us spending far too much and getting way too little. She also offers practical ways to reduce overtreatment and redirect those resources to better health. Is Healthcare is already fixed? It is! Check it out at The Health Rosetta by Dave Chase. Includes a good summary TEDx Talk and the eBook The CEO’s Guide to Restoring the American Dream: How to Deliver World-Class Healthcare to Your Employees at Half the Cost. There Dave demonstrates how self-insured employers can change the fundamental economics to the benefit of their employees’ quality of life and pocketbooks. This one was distilled into the longest article ever published in Newsweek. For good reason. America’s Bitter Pill: Money, Politics, Backroom Deals, and the Fight to Fix our Broken Healthcare System, by Steven Brill. It highlights the rampant abuses and profiteering in America’s largest and most dysfunctional sector of the economy. Think drug prices are high because they’re investing so much to research miraculous new cures? Ah, no. Think again. The Truth about Drug Companies: How They Deceive Us and What to Do About It. by Marcia Angell, MD. Dr. Angell has unique insights after 20yrs at the New England Journal of Medicine with a ringside seat as drug companies gained nearly limitless influence over medical research, education and how doctors prescribe. Hint – their behaviors were not primarily driven by what’s best for patients. © 2020 Richfield Press. All rights reserved. The author can be followed at:Terry-howell@sbcglobal.nethttps://www.linkedin.com/in/w-terry-howell-ed-d/ |
Today lessons. First, the world is not going to end anytime soon (unless a asteriod hits like it did the Dinosaur 65 million years ago and I will be proven wrong but it will be by the hand of nature uncontrollable.)
Empiric evidence needs to be considered. The planet is greener, the world is wealthier, more people getting fed and only in those countries where corruption and Marxism ideas prevail are people truly starving in the street. Venezuela anyone?
In the developed world, poverty is the exception and not the rule. If the planet is greener (we can debate why, my own view is human ingenuity in managing the planet plus a little extra CO2 doesn’t hurt.)
On the day, we should be thankful for what we have and more importantly, following ideas that begin with the human mind as the most important resource and human freedom to pursue our dreams, our passon and liberate the human mind.
Our prospersity is not a forgone conclusion in the future since there is always that mindset that rules against human freedom and when they get in charge, poverty follows. We are one generation from extinction and one generaton from further greatness. The choice is ours
This is one of those inaccurate and stupid statements made about the climate debate. Skeptics and Alarmists have from the very beginning agreed the climate has been warming. The Alarmist arguments that it is human driven. ContinuedQuote Tweet

Doug Cottrell

@DCottrell1956 · 15hReplying to @BadgersNo @TheDisproof and 43 othersThe debate about WHETHER there is climate change is long past. It is happening. It is in the news. The changes have primary and secondary and tertiary impacts.
The skeptics are not as certain what human role is and whether C02 is the driving force. If one looks at the actual empiric evidence, it favors the skeptics from the failure of computer models and overall failed predictions by alarmists on what the nature of the planet would be.
The Planet is greening (there is a debate on why including human conservation actions and slight increase of C02 aiding planet growth) and we are feeding more people and more people are living above the poverty line so the disaster predicted for our planet have failed to happen.
The irony is that countries that having problems are those countries that followed many of the policy recommendations of alarmist of heavy dose of government policies
In states or countries that depend more on wind and solar tend to have less dependable and more expensive energy. Those countries that depend upon nuclear, fossil fuels or hydro have more dependable energy sources and less expensive.
Alarmist policies have always included higher energy prices to move away from fossil fuels and nuclear so the cost of energy going up is not a surprise but part of the policies. Note: most people when confronted with cost don’t like it.
Skeptics as a group tend to believe in market approaches (even though there are liberal or leftist views on the economy) and those market approach will work to reduce pollution and C02 emissions. Plus allow the economy to grow and produce.
Some believers in AGW like Michael Shellenberger agrees with some of the Skeptics approaches as he has openly questioned the push to wind and solar and favors a more traditional approach including nuclear energy.
This is not a debate about warming but why it is warming, why it warmed in the past and best approach to provide energy policies that is a clean as possible while allowing economic growth. Alarmists like to bring up straw men that don’t exist. Thus their dishonesty.
From Swampgirl : History denied & Lorentide. Glacial maxima & interglacial periods. Our path around the sun has created the freeze or burn. 10,000 years ago during such time, the Earth came closest to the sun in July. The Northern hemisphere got 8% more radiation in summer than it does today.
Why be skeptical? Here is a thought, you think Polar Bears won’t adjust to the conditions around them and the Artic ocean will ice free or whatever and you find several years later, you find the bears are thriving and doing well.
Studies have shown the Bear population has stablished or increased, not dropped by 67% as predicted. (some keep predicting drops but considering past record, one has to be skeptical. ) Would you think great, the Bears are surviving
Instead of celebrating, you fire the scientist found this be true and try to prove the opposite. That is why climate science, which is relatively new, needs to question. It has been hijacked by political activists with PHD and activists with an agenda.
The number one thing often missing in economics is not taking human ingenuity in account. That is why we are feeding more people today or that the world has become wealthier. Part of it began with Reagan Revolution and collapsed of Communism. India began its own reform.
South Korea showed what happens when markets are allowed as this country went from being one of the poorest to one of the richest within 50 years.
The biggest threat that we have is reversing the trends that made up for this success. We won’t see famine or poverty as result of a warmer planet but if we retreat from economic freedom and move toward socialism in the West and the developed countries.
The threat from warmer planet is overrated (look up the history and you will see humans in the past did better when the planet was warmer. It is recorded in the history book. ) More people die in colder weather than warmer and science backs that up.
This represent a serious of tweets on Energy with another individual.
It is amazing that over the years, we were told we are running out of energy but yet we keep finding even more.https://investors.com/politics/commentary/we-are-not-running-out-of-oil-earth-produces-crude/… This individual is wrong for so many reason and one reason Bonus doesn’t understand free market or study the energy market over the past decades
FROM Bonus i Sorry to burst your somewhat fragile bubble but fossil fuels are going to be replaced whether you like it ir not. Reason: they are finite and over 90% of the population of the world is covered by governments who signed up to the Paris accord.
From Bonus What year will we run out of fossil fuels? Do you understand the exponential growth function?
Me: Not anytime soon, do you not understand economics? Note also that if you examine past predictions of what we have left, it often UNDERESTIMATED energy sources. So you are debating the wrong person, I read your data and mine is superior. We are nowhere near running out.
Bonus Then what year? At what rate of annual growth in consumption?
Me: Well tell me what year do you predict? Let me explain this so even you can understand. We don’t know since we are finding more than expected with newer technology like fracking. So if you can’t answer the questions and you can’t, then history is our guide.
Bonus The problem you have is exponential growth. Do you know why?
Me: You are working on the assumption that we have a specific finite materials and refuse to see that we are finding more than original predictions. If you predict x and we find y which is triple of x, due to new technology then we have totally different scenario.
I find your point of exponential growth irrelevant since we have not clue what we will be able to find at the right price. What is expensive to find today is not tomorrow, then we find more. Your exponential growth is based that you think we have x amount.
We are at impasse since you coming from we have a limited amount and I am making the point that what we think we have today UNDERESTIMATE what we might have since new technology may find more price reasonable. I get your point
Just look at population, we were told for 200 plus years we have finite resources to support population but we find that due to human ingenuity, we find more resources supporting growing population. Exponential growth in population theories have already been proven wrong.
